
At-a-Glance 👀
Purpose
This project aims to design and implement a regression model that accurately predicts the next-day average temperature in Seoul, South Korea. Accurate temperature prediction has significant implications for various sectors, including agriculture, transportation, and public safety.
Background
Weather prediction, especially temperature forecasting, is critical for planning and decision-making across different domains. Traditional methods rely on complex physical models that simulate atmospheric conditions. However, with advancements in machine learning, there is an opportunity to leverage historical data to predict weather outcomes with high accuracy and potentially faster computation times. This project seeks to harness these advancements to create a reliable regression model for temperature prediction.
Objectives
The primary objectives of this project are:
- Data Exploration and Understanding:
- Conduct exploratory data analysis (EDA) to understand the characteristics and distributions of the dataset.
- Data Preprocessing:
- Handle missing values and outliers.
- Normalize or standardize the features as necessary.
- Feature Selection:
- Select relevant features for the regression analysis.
- Model Development:
- Select appropriate machine learning algorithms for regression.
- Train and validate the model using a portion of the dataset.
- Test the model's performance on a separate dataset.
- Model Evaluation:
- Evaluate the model's accuracy using metrics such as Mean Absolute Error (MAE), Root Mean Squared Error (RMSE), and R-squared (R²).
Best Model and Learning Curve
To determine the best model and evaluate its performance, the following steps were taken:
- Model Selection:
- Various regression algorithms were considered, including Linear Regression, Decision Trees, Random Forest, and others.
- Training and Validation:
- The dataset was split into training and testing sets.
- Models were trained on the training set and validated using cross-validation techniques.
- Performance Evaluation:
- The model's performance was evaluated using MAE, RMSE, and R².
Correlation Heatmap Analysis
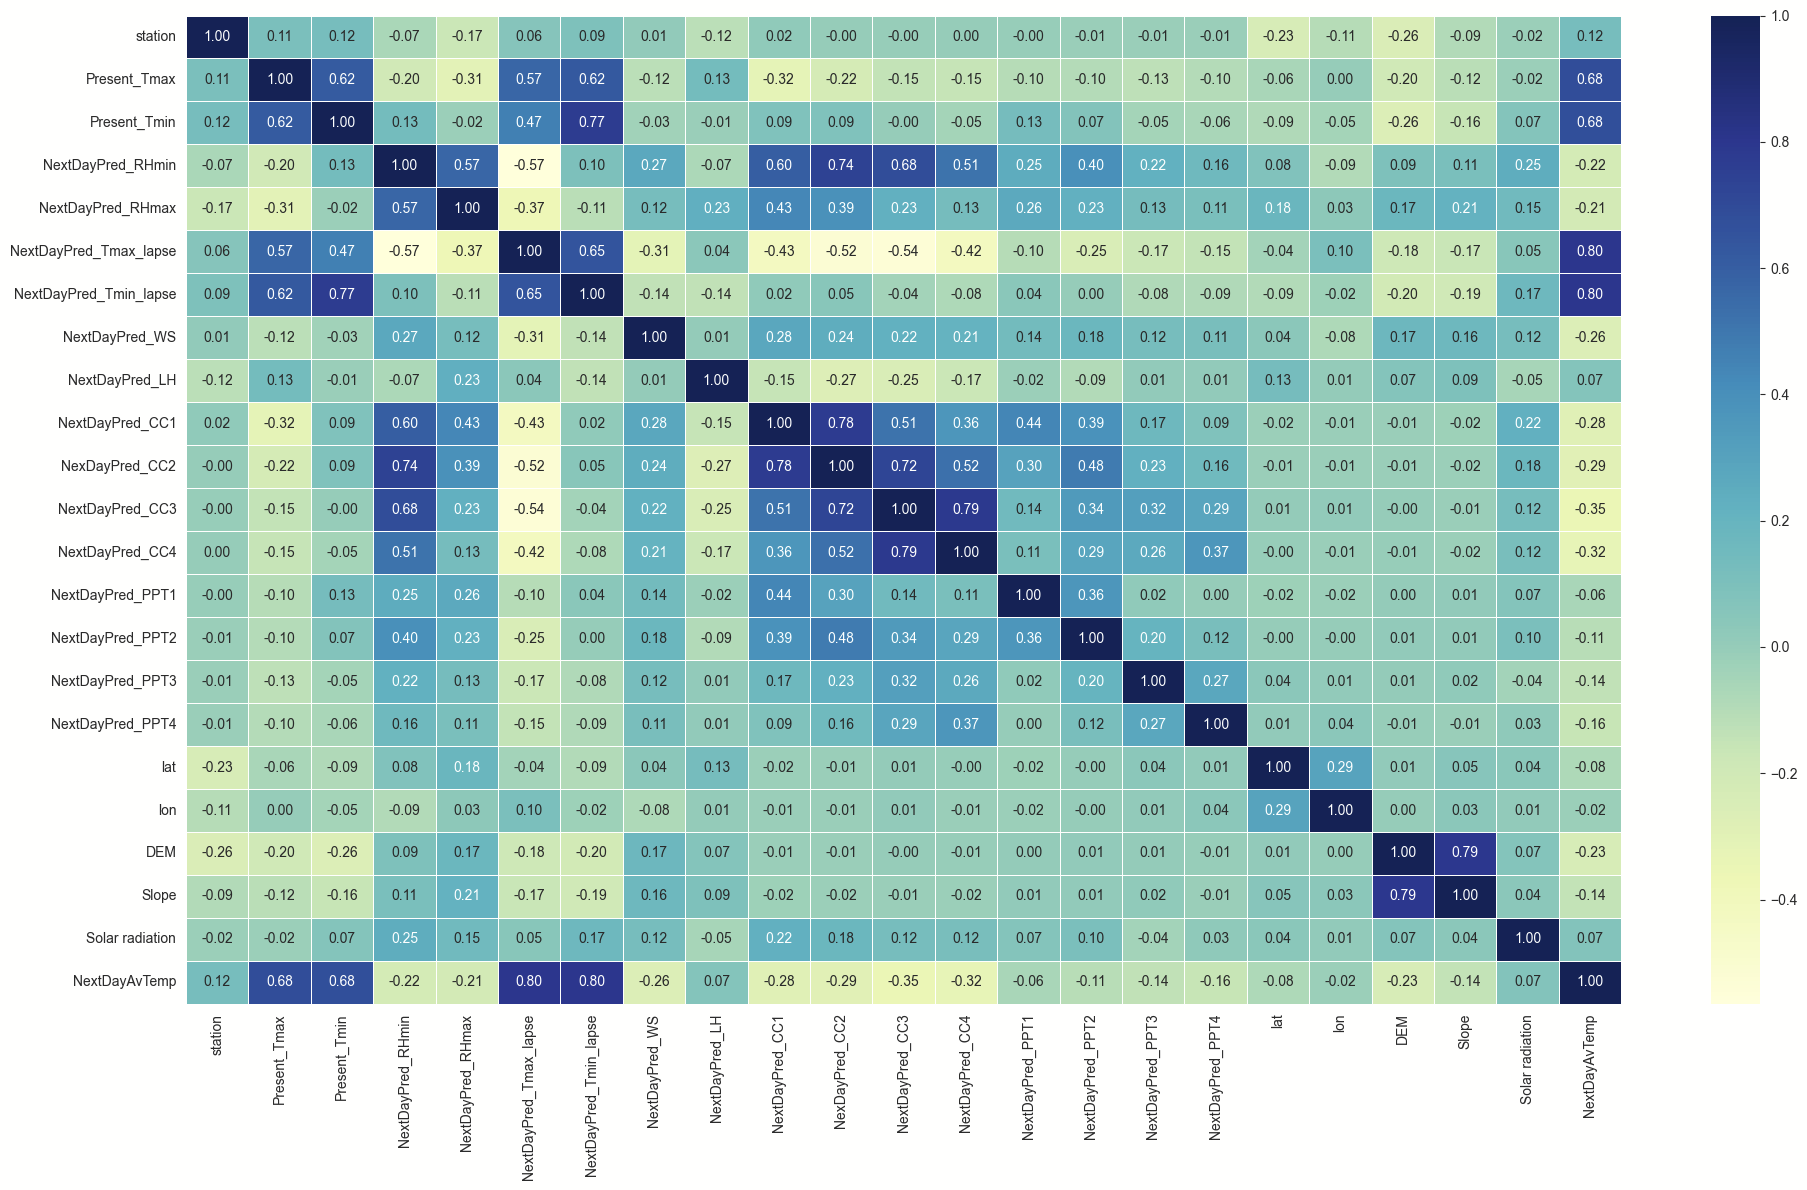
The correlation heatmap above visualizes the relationships between various features in the dataset used for predicting the next-day average temperature in Seoul, South Korea. The heatmap represents the Pearson correlation coefficients, which range from -1 to 1. Here's an explanation of the key elements:
Explanation
- Correlation Coefficients:
- Positive Correlation: Values closer to 1 signify a strong positive relationship.
- Negative Correlation: Values closer to -1 signify a strong negative relationship.
- No Correlation: Values around 0 indicate no linear relationship.
- Color Gradient:
- Dark blue: Strong negative correlations.
- Light blue to green: Weak or no correlations.
- Yellow to white: Strong positive correlations.
- Key Observations:
- Strong Positive Correlations:
- Present_Tmax & NextDayPred_Tmax_lapse (0.80)
- Present_Tmin & NextDayPred_Tmin_lapse (0.80)
- NextDayPred_LH & NextDayPred_WS (1.00)
- DEM & Slope (0.79)
- Target Variable (NextDayAvTemp):
- Strongly correlated with Present_Tmax (0.68), Present_Tmin (0.68), and NextDayPred_Tmax_lapse (0.80).
Univariate Analysis for Numerical Features with high correlation to target variable.
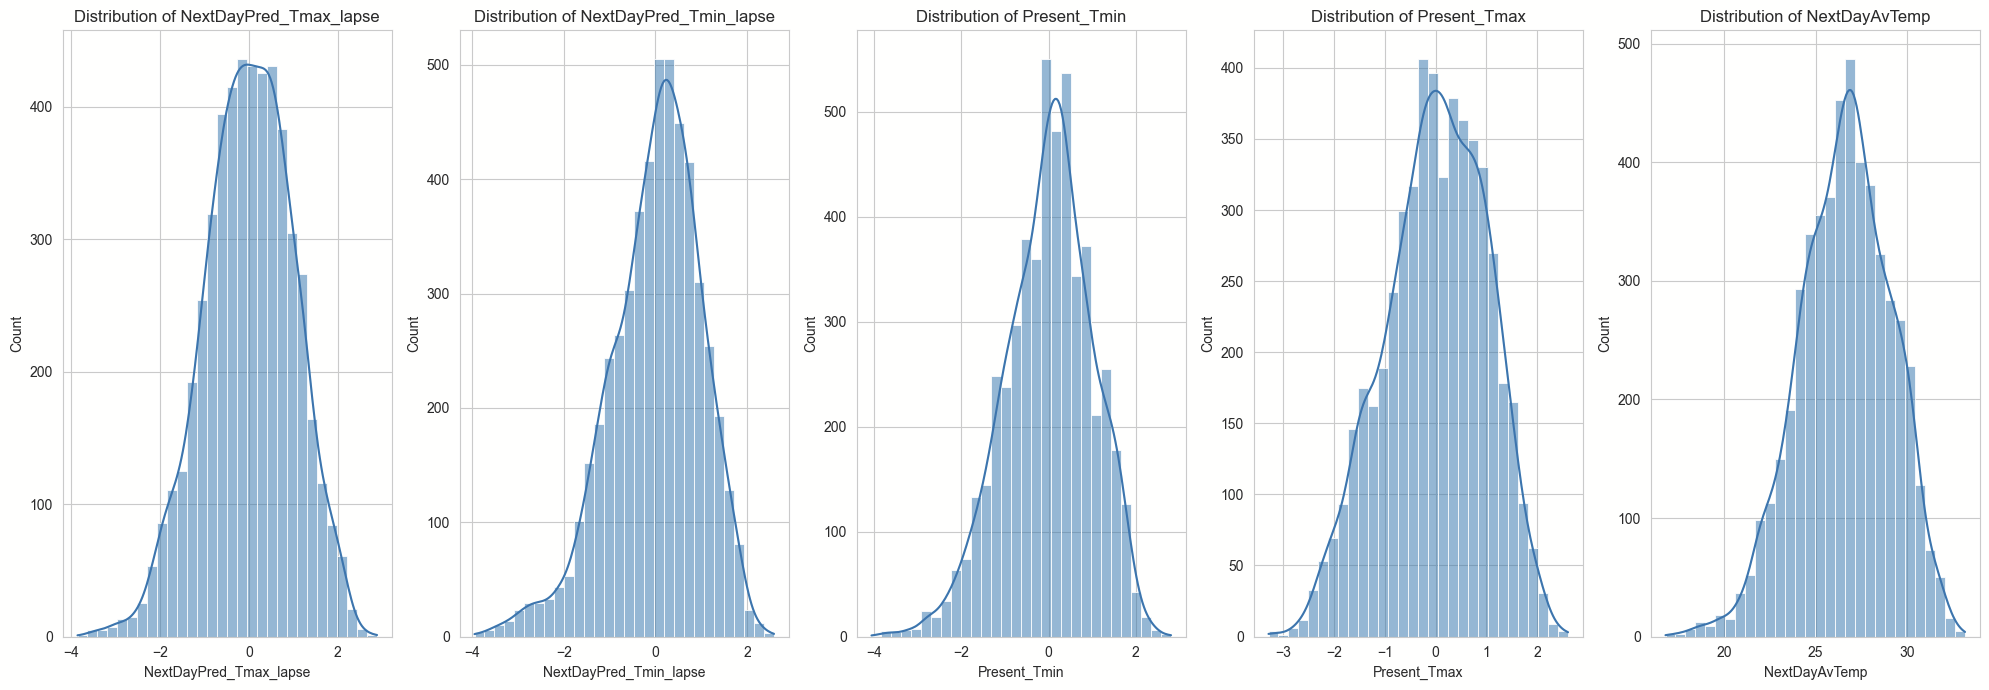
Key Insights from Univariate Analysis: The distributions appears roughly normal with the mean and median closely aligned, indicating a symmetrical spread of data points around the central value. This suggests that there is an equal likelihood of observing data points on either side of the mean. This pattern indicates that the majority of the observations are clustered around the mean, with fewer instances of extreme values in either direction.
Learning Curves for Various Models
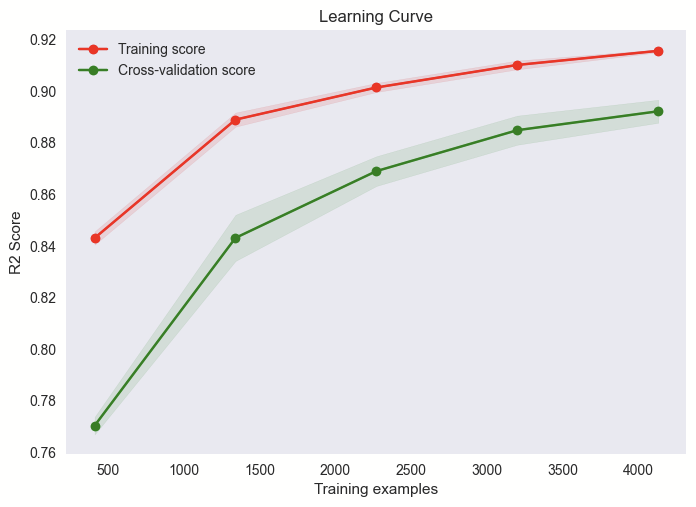
- Learning Curve:
- Learning curves were plotted to visualize the model's performance over the training process, showing how the error rates change with varying sizes of the training dataset.
- Learning Curve: The learning curve for the Random Forest model would show a decreasing trend in error (MAE or RMSE) as the size of the training data increases, indicating the model's ability to generalize better with more data.
